Fig. 3
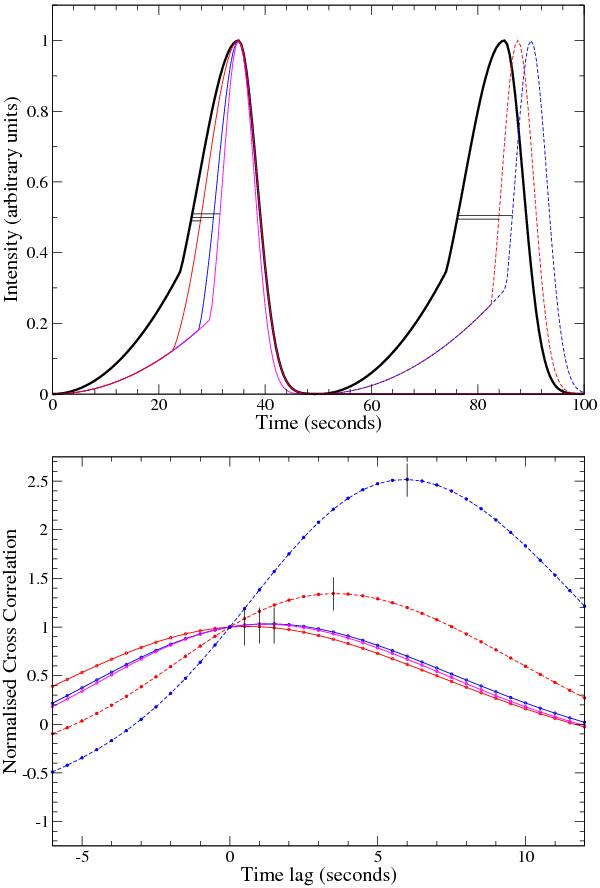
Top panel: simulated light curves: the thick black curve represents the one at low energies; the others show three different examples of higher energy data. The left-hand curves show the case when leading sides are delayed with respect to the low energy, but the trailing sides are the same in two cases and slightly different in the third one. In the right-hand curves, different shifts between the pulse maxima and decays are introduced. Bottom panel: the cross-correlation functions for the simulated light curves normalised to the values of zero lag. Colours are the same as the corresponding simulated data.
Current usage metrics show cumulative count of Article Views (full-text article views including HTML views, PDF and ePub downloads, according to the available data) and Abstracts Views on Vision4Press platform.
Data correspond to usage on the plateform after 2015. The current usage metrics is available 48-96 hours after online publication and is updated daily on week days.
Initial download of the metrics may take a while.