Fig. 12
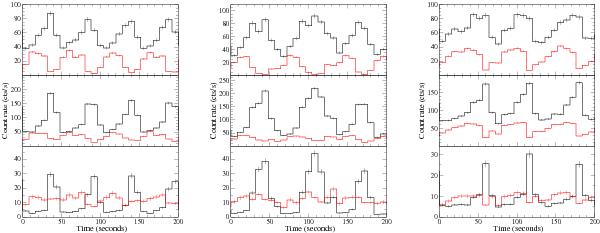
Short segments 200 s long of the count rates of the light curves for the multi-temperature disk (black) and the corona (red) emission components in the three energy ranges [1.7–3.4] (top), [3.4–6.8] (centre), and [6.9–10.2] keV (bottom) for the three series A8b (left panel), E5 (central panel), F7 (right panel). Rates relative to the corona were multiplied by 8 in the energy range [1.7–3.4] keV and by 2 in the other ranges to superimpose the light curves on the disk ones.
Current usage metrics show cumulative count of Article Views (full-text article views including HTML views, PDF and ePub downloads, according to the available data) and Abstracts Views on Vision4Press platform.
Data correspond to usage on the plateform after 2015. The current usage metrics is available 48-96 hours after online publication and is updated daily on week days.
Initial download of the metrics may take a while.