Fig. 11
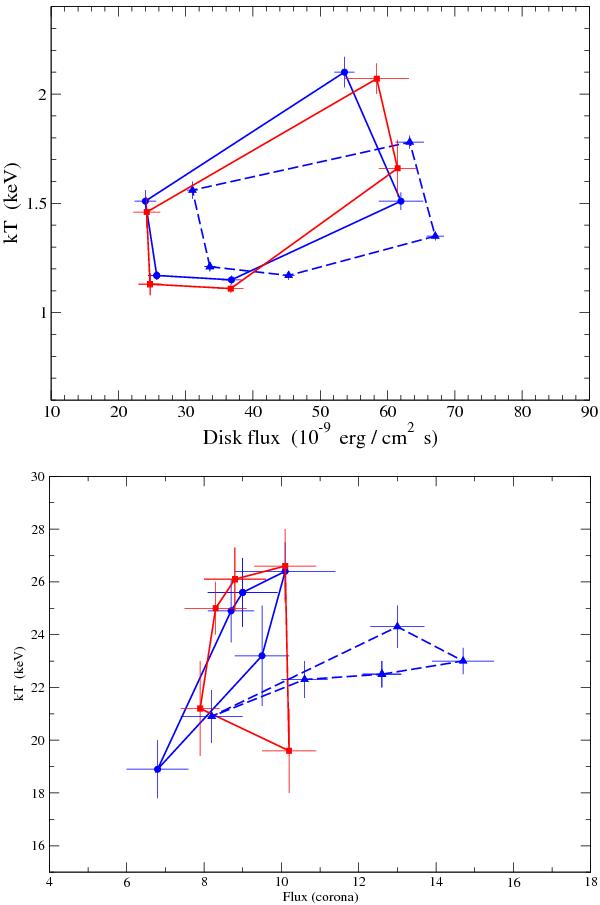
Upper panel: evolution of spectral parameters of the disk component (see Paper I, Table 2) in the five segments of the bursts in the three intervals: I (solid blue line); II (solid red line); III (dashed blue line). Lower panel: evolution of spectral parameters of the coronal component (see Paper I, Table 2) in the same five segments of the bursts as in the upper panel.
Current usage metrics show cumulative count of Article Views (full-text article views including HTML views, PDF and ePub downloads, according to the available data) and Abstracts Views on Vision4Press platform.
Data correspond to usage on the plateform after 2015. The current usage metrics is available 48-96 hours after online publication and is updated daily on week days.
Initial download of the metrics may take a while.