Fig. 9
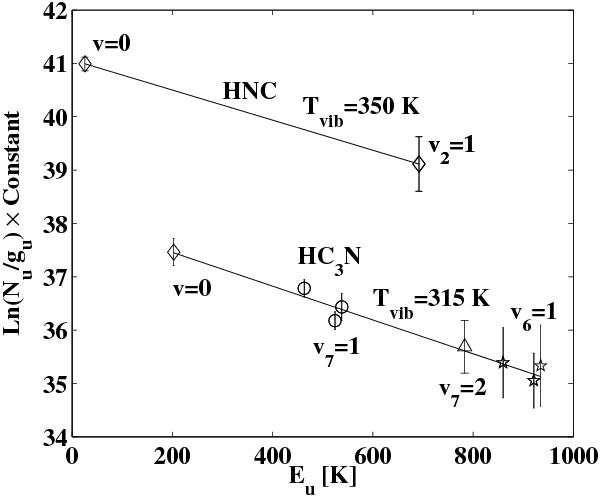
Population diagram for vibrationally excited HNC and HC3N. For HNC, the data points relative to the J = 3, v = 0, and v2 = 1 states are shown as open diamonds. For HC3N, the J = 30, v = 0 state is drawn as a diamond, while the v6 = 1, v7 = 1, and v7 = 2 values, derived from all the observed transitions, are shown as stars, circles, and a triangle. The solid lines show the vibrational temperature fit, while error bars represent 1σ uncertainties. For a discussion see Sect. 4.2.2.
Current usage metrics show cumulative count of Article Views (full-text article views including HTML views, PDF and ePub downloads, according to the available data) and Abstracts Views on Vision4Press platform.
Data correspond to usage on the plateform after 2015. The current usage metrics is available 48-96 hours after online publication and is updated daily on week days.
Initial download of the metrics may take a while.