Fig. 3
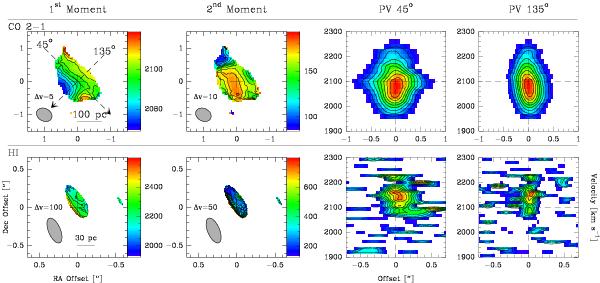
Kinematics of CO 2–1 emission and HI absorption. The first and second moments of the deconvolved data-cubes are shown, together with position-velocity diagrams along the major (45°) and minor (135°) axis of the molecular emission. The color scale starts at a signal-to-noise ratio of 5. In the first- and second-moment maps, the contour spacing is shown as Δv, in km s-1. Notice the velocity shift in the PV diagrams of CO 2–1 and HI. For discussion, see Sects. 3.2, and 4.1.1.
Current usage metrics show cumulative count of Article Views (full-text article views including HTML views, PDF and ePub downloads, according to the available data) and Abstracts Views on Vision4Press platform.
Data correspond to usage on the plateform after 2015. The current usage metrics is available 48-96 hours after online publication and is updated daily on week days.
Initial download of the metrics may take a while.