Fig. 12
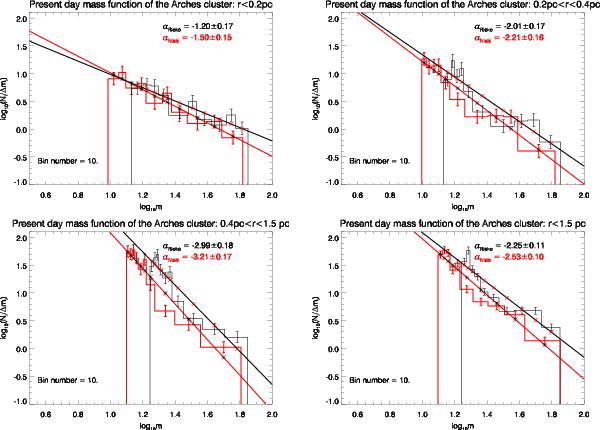
Present-day mass function of the Arches cluster. Red lines correspond to the mass distribution derived based on the N-EL, while black lines represent the mass function assuming the RL-EL. Both mass functions are fitted with a power-law like function with reported slopes of α shown in the respective color. The mass functions are plotted in three regions: a) the inner core of r < 0.2 pc; b) the intermediate annulus of 0.2 < r < 0.4 pc and; c) the cluster outskirts of 0.4 < r < 1.5 pc. The mass function steepens as we move outward from the cluster center. The complete mass distribution of the cluster within r < 1.5 pc d) is consistent within the uncertainties with a Salpeter IMF. The illustrated error for the slopes only represents the numerical fitting uncertainties (see Table 4, and Sect. 5.2 for a discussion).
Current usage metrics show cumulative count of Article Views (full-text article views including HTML views, PDF and ePub downloads, according to the available data) and Abstracts Views on Vision4Press platform.
Data correspond to usage on the plateform after 2015. The current usage metrics is available 48-96 hours after online publication and is updated daily on week days.
Initial download of the metrics may take a while.