Fig. 11
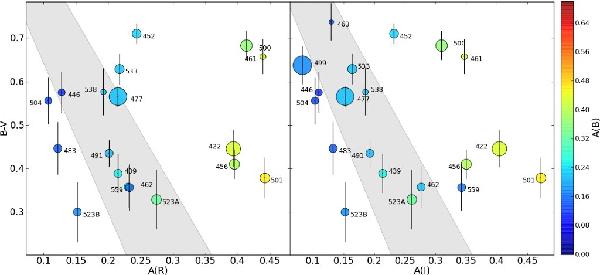
B − V total color (Table 4) vs. the AP asymmetry in the R (left panel), and the I bands (right panel). The markers are color-coded by their B band asymmetry, while their size reflects their Holmberg radius rH. The gray area is the location of the fiducial galaxy color-asymmetry sequence as defined in Conselice et al. (2000).
Current usage metrics show cumulative count of Article Views (full-text article views including HTML views, PDF and ePub downloads, according to the available data) and Abstracts Views on Vision4Press platform.
Data correspond to usage on the plateform after 2015. The current usage metrics is available 48-96 hours after online publication and is updated daily on week days.
Initial download of the metrics may take a while.