Fig. 6
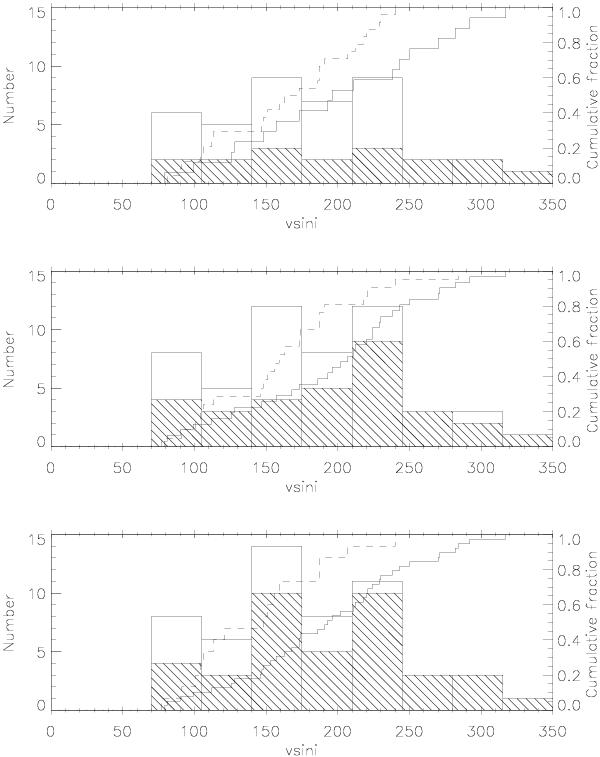
Targets showing partial variability over <1 yr (top), ~1 yr (middle) and ~10 yrs (bottom). The hollow histograms represent the distribution of targets as a function of vsin i. The hatched histograms show the distribution of those targets displaying partial variability. The cumulative fractions have been overplotted for those targets displaying partial variability (solid line) and those not (dashed line).
Current usage metrics show cumulative count of Article Views (full-text article views including HTML views, PDF and ePub downloads, according to the available data) and Abstracts Views on Vision4Press platform.
Data correspond to usage on the plateform after 2015. The current usage metrics is available 48-96 hours after online publication and is updated daily on week days.
Initial download of the metrics may take a while.