Fig. 2
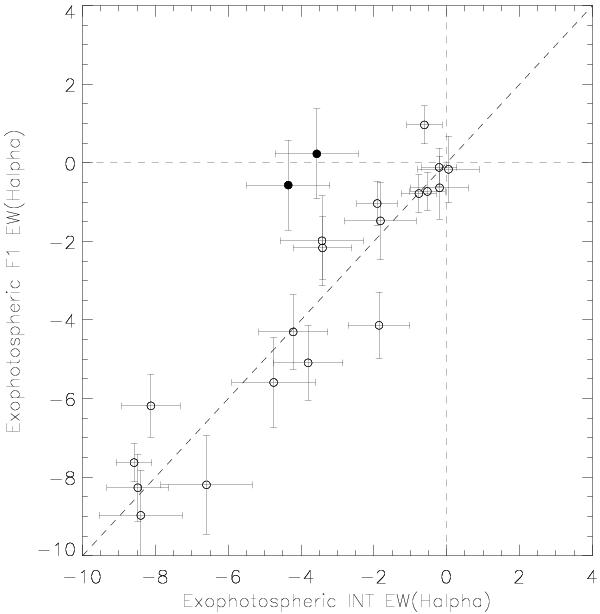
Determined exophotospheric EWs plotted for the INT-F1 baseline. The scale has been selected to show all targets that exhibited either disk loss or formation. Targets that have been identified as losing their disk are illustrated with filled circles. The stability line (y = x) and disk loss/formation (y = 0, x = 0) axes are shown.
Current usage metrics show cumulative count of Article Views (full-text article views including HTML views, PDF and ePub downloads, according to the available data) and Abstracts Views on Vision4Press platform.
Data correspond to usage on the plateform after 2015. The current usage metrics is available 48-96 hours after online publication and is updated daily on week days.
Initial download of the metrics may take a while.