Fig. 9
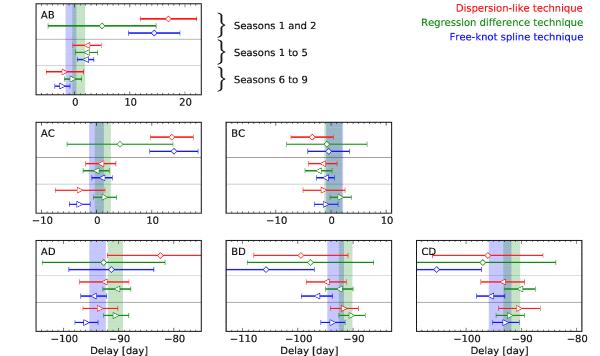
Application of the curve-shifting techniques to subsections of the full light curves. The square diamonds (top) show measurements using only the first two seasons, the leftward triangles (middle) use the first five seasons, and the rightward triangles (bottom) use the last four seasons. All error bars depict total errors, as in Fig. 6. The blue- and green-shaded regions correspond to the interval covered by the total error bars using the full nine seasons, by the spline and regression difference techniques, respectively.
Current usage metrics show cumulative count of Article Views (full-text article views including HTML views, PDF and ePub downloads, according to the available data) and Abstracts Views on Vision4Press platform.
Data correspond to usage on the plateform after 2015. The current usage metrics is available 48-96 hours after online publication and is updated daily on week days.
Initial download of the metrics may take a while.