Fig. 8
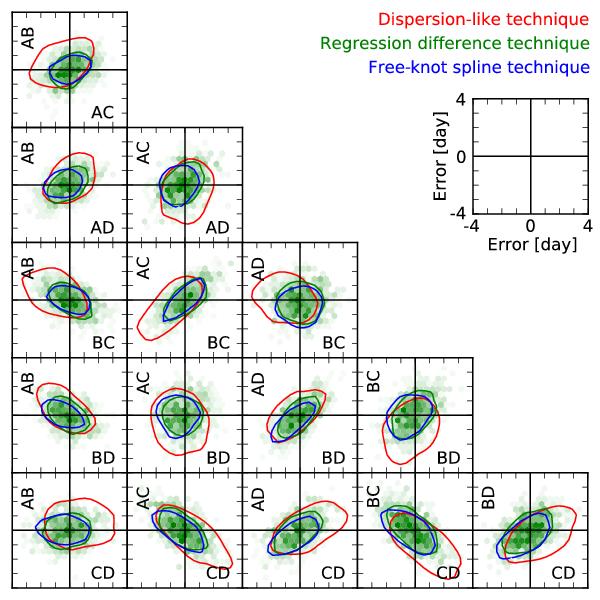
Correlations of delay measurement errors for synthetic light curves mimicking RX J1131−1231. The measurement errors are the same as shown in Fig. 7, but this time marginalizing over the true delays. Crosshairs indicate zero error, and the inset shows the scale of each panel. For clarity, only single contours at half of the maximum density are shown for two of the techniques. We observe no correlations (i.e., oblique contours) between the unrelated delay measurements along the short diagonal of this figure.
Current usage metrics show cumulative count of Article Views (full-text article views including HTML views, PDF and ePub downloads, according to the available data) and Abstracts Views on Vision4Press platform.
Data correspond to usage on the plateform after 2015. The current usage metrics is available 48-96 hours after online publication and is updated daily on week days.
Initial download of the metrics may take a while.