Fig. 7
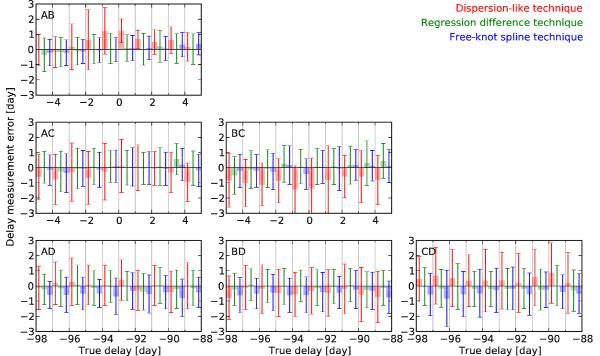
Results of the Monte Carlo analysis leading to the error estimates for our time-delay measurements shown in Fig. 6. We obtain our uncertainty estimates by applying the curve-shifting techniques to 1000 synthetic light curve sets that closely mimic the observed data but have known true time delays. The vertical axes show the delay measurement error, which is compared with the true delays used to generate the synthetic curves (horizontal axes). Separately for each panel, the outcomes are binned according to the true time delays. The bin intervals are shown as light vertical lines. Within each bin, the shaded rods and error bars show the systematic and random errors, respectively, of the delay measurements for each technique.
Current usage metrics show cumulative count of Article Views (full-text article views including HTML views, PDF and ePub downloads, according to the available data) and Abstracts Views on Vision4Press platform.
Data correspond to usage on the plateform after 2015. The current usage metrics is available 48-96 hours after online publication and is updated daily on week days.
Initial download of the metrics may take a while.