Fig. 6
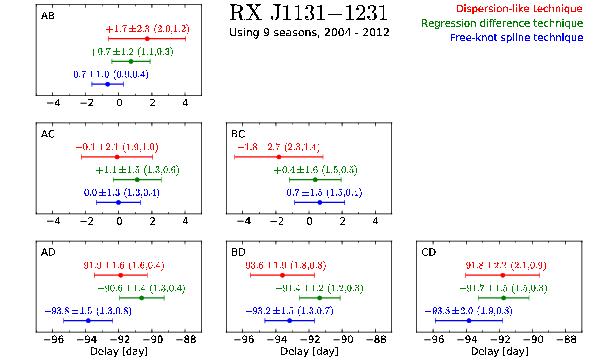
Time-delay measurements along with the 1σ errors for RX J1131−1231 obtained by our three standard techniques from the full nine-season-long light curves shown in Fig 4. The random and systematic error contributions are given in parentheses for each delay. The error bars represent the random plus systematic errors summed in quadrature. A positive AB-delay ΔtAB means that image B leads image A. We consider the measurements from the regression difference technique, which display the lowest bias and variance in our error analysis as the delays that should be used to constrain cosmology and lens models.
Current usage metrics show cumulative count of Article Views (full-text article views including HTML views, PDF and ePub downloads, according to the available data) and Abstracts Views on Vision4Press platform.
Data correspond to usage on the plateform after 2015. The current usage metrics is available 48-96 hours after online publication and is updated daily on week days.
Initial download of the metrics may take a while.