Fig. 4
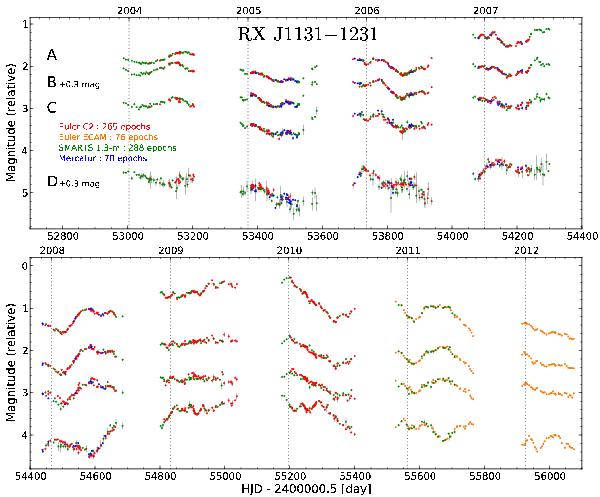
Optical monitoring of RX J1131−1231, as obtained from deconvolution photometry. From top to bottom are shown the R-band light curves for the quasar images A, B, C, and D along with the 1σ photometric error bars. Colors encode the contributing instruments. Curves B and D have been shifted by +0.3 mag for display purposes. The light curves are available in tabular form from the CDS and the COSMOGRAIL website.
Current usage metrics show cumulative count of Article Views (full-text article views including HTML views, PDF and ePub downloads, according to the available data) and Abstracts Views on Vision4Press platform.
Data correspond to usage on the plateform after 2015. The current usage metrics is available 48-96 hours after online publication and is updated daily on week days.
Initial download of the metrics may take a while.