Fig. 8
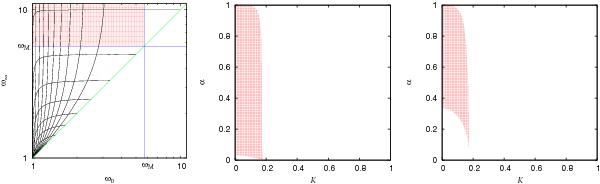
Left panel: graph of  versus
  calculated for the PSD from Eq. (4). The deformed grid of contour lines corresponds to curves of α = const. and K = const. in the parameter space of the model, where ω∞ ≥ ω0 by construction. It follows that the image of the entire parameter space lies above the green diagonal line of ω∞ = ω0. Middle panel: the upper-left rectangular sector of acceptable pairs of ω0 and ω∞ from the left panel is projected back onto the (α,K) parameter space. Assuming the first-order boundaries of and , the pairs of α vs. K outside of the filled (red) area lead to the power spectrum, which can not have any local extrema at ωM. These parameter values are therefore ruled out. Right panel: analogical to the middle panel, but employing tighter (second-order) boundaries
  and
and  ; in this case, the parameter constraints are more stringent (the filled area is smaller).
Current usage metrics show cumulative count of Article Views (full-text article views including HTML views, PDF and ePub downloads, according to the available data) and Abstracts Views on Vision4Press platform.
Data correspond to usage on the plateform after 2015. The current usage metrics is available 48-96 hours after online publication and is updated daily on week days.
Initial download of the metrics may take a while.