Fig. 6
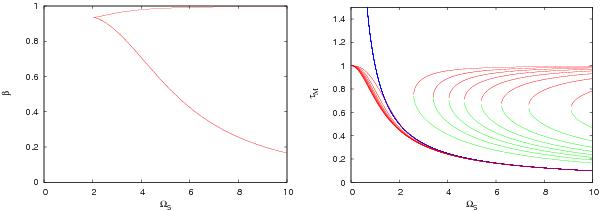
Left: boundary of set CM of doubly-peaked power spectra ωSrD(ω). Right: time-scales τM calculated for β from the set { 0.1, 0.2, 0.3, 0.4, 0.5, 0.6, 0.7, 0.8, 0.9 } and for Ωs from the interval ⟨ 0,10 ⟩. The blue line corresponds to  . Again, the red lines denote the τM of the peaks, and the green lines denote the local minimum.
Current usage metrics show cumulative count of Article Views (full-text article views including HTML views, PDF and ePub downloads, according to the available data) and Abstracts Views on Vision4Press platform.
Data correspond to usage on the plateform after 2015. The current usage metrics is available 48-96 hours after online publication and is updated daily on week days.
Initial download of the metrics may take a while.