Fig. 2
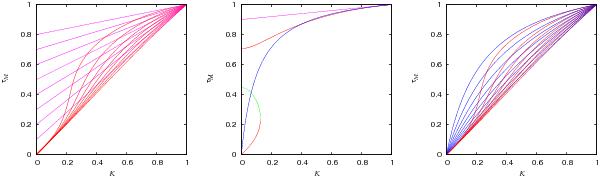
Left: comparison of the time-scales τM (red) and E[τ] (magenta). The lines are calculated for α from the set {0.1, 0.2, 0.3, 0.4, 0.5, 0.6, 0.7, 0.8}, avoiding set CM. Middle: as in the left panel, but for α = 0.9. For low K this corresponds to double-peaked power spectra. The red curves correspond to 1 over the peak frequency, the green is for the minimum. The blue curve denotes the time-scale 1 / E[1 / τ]. Right: comparison of the time-scales τM (red) and 1 / E[1 / τ] (blue).
Current usage metrics show cumulative count of Article Views (full-text article views including HTML views, PDF and ePub downloads, according to the available data) and Abstracts Views on Vision4Press platform.
Data correspond to usage on the plateform after 2015. The current usage metrics is available 48-96 hours after online publication and is updated daily on week days.
Initial download of the metrics may take a while.