Fig. 1
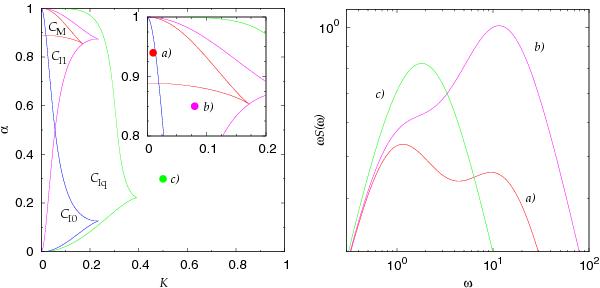
Left panel: diagram describing the morphology of the PSD profiles according to Eq. (4) for all possible values of the parameters α and K. Different curves represent the boundaries of subsets of the parameters for which the PSD exhibits a double-feature. The red curve encloses set CM of the doubly peaked power spectra. The other curves correspond to the sets of power spectra with a nontrivial structure of inflection points CI0 (blue), CI1 (magenta) and CIq (green). Right panel: three examples of the PSD profiles. A double-peaked power spectrum (red) with parameters α = 0.94 and K = 0.01 (i.e., the values within set CM, as denoted by the red point in the left panel), doubly-broken power spectrum with a single local maximum (magenta) corresponding to α = 0.85 and K = 0.08 (the magenta point within set CI1 and outside of CM) and a power spectrum with single maximum and break (green) with α = 0.5 and K = 0.5 (the green point outside of CIq).
Current usage metrics show cumulative count of Article Views (full-text article views including HTML views, PDF and ePub downloads, according to the available data) and Abstracts Views on Vision4Press platform.
Data correspond to usage on the plateform after 2015. The current usage metrics is available 48-96 hours after online publication and is updated daily on week days.
Initial download of the metrics may take a while.