Fig. 6
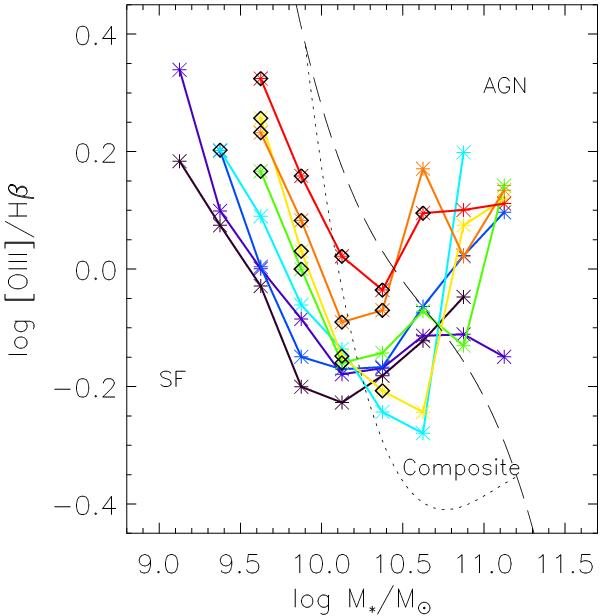
New diagnostic diagram (MEx) by Juneau et al. (2011) uses the stellar mass instead of the [NII]/Hα emission line ratio. In this plot, every color represents the evolution in mass for a fixed redshift bin (the whole z-range): 0.177 < z < 0.242 (black), 0.242 < z < 0.306 (purple), 0.306 < z < 0.371 (blue), 0.371 < z < 0.436 (light blue), 0.548 < z < 0.632 (green), 0.632 < z < 0.716 (yellow), 0.716 < z < 0.8 (orange), and 0.8 < z < 0.884 (red). The mass increases from left to right along each track. The black diamonds indicate mass incompleteness (see Fig. 1).
Current usage metrics show cumulative count of Article Views (full-text article views including HTML views, PDF and ePub downloads, according to the available data) and Abstracts Views on Vision4Press platform.
Data correspond to usage on the plateform after 2015. The current usage metrics is available 48-96 hours after online publication and is updated daily on week days.
Initial download of the metrics may take a while.