Fig. 5
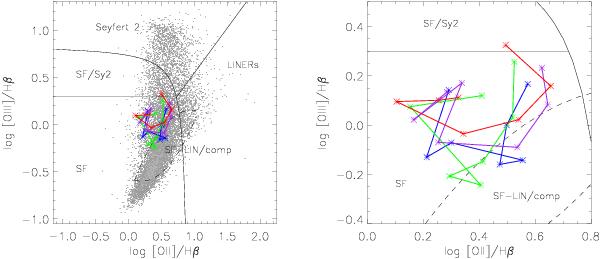
[OII] diagnostic diagram. [OII]/Hβ fux dust-corrected ratios are used. The demarcation lines are taken from Lamareille (2010). Each color represents the trend with stellar mass for a fixed redshift bin: 0.548 < z < 0.632 (blue), 0.632 < z < 0.716 (green), 0.716 < z < 0.8 (purple), and 0.8 < z < 0.884 (red). The total stellar mass increases from left to right. In the left panel, the SDSS galaxies from Vitale et al. (2012) are plotted in gray. The right panel shows a closer view of the zCOSMOS galaxies.
Current usage metrics show cumulative count of Article Views (full-text article views including HTML views, PDF and ePub downloads, according to the available data) and Abstracts Views on Vision4Press platform.
Data correspond to usage on the plateform after 2015. The current usage metrics is available 48-96 hours after online publication and is updated daily on week days.
Initial download of the metrics may take a while.