Fig. 2
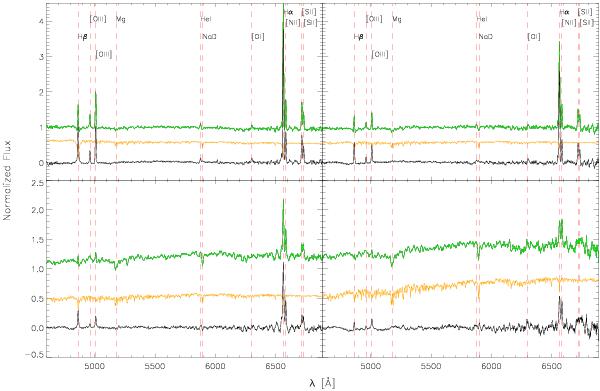
Four examples of stellar continuum subtraction at low redshift (z < 0.436, one per redshift bin). For each panel, the original stacked spectrum (green), the most suitable stellar continuum to be subtracted (orange) and the resulting zCOSMOS stacked spectrum after the stellar continuum subtraction (black) are shown. The main emission and absorpion lines are labeled at the top top. From top to bottom and from left to right total stellar mass and redshift increase. Top-left panel: stacked spectrum of the bin 9.25 ≤ log M∗/M⊙ < 9.5, 0.177 ≤ z < 0.242, stellar template representing a 290-Myr-old simple stellar population (SSP) with Z = 0.2 and E(B − V) = 0.4; top-right panel: 9.75 < log M∗/M⊙ ≤ 10, 0.242 ≤ z < 0.306, 12-Gyr-old stellar template with exponential decay of the star formation, Z = 0.2 and E(B − V) = 0.2; bottom-left panel: 10.25 ≤ log M∗/M⊙ < 10.5, 0.306 ≤ z < 0.371, 900-Myr-old SSP with Z = 0.5 and E(B − V) = 0.4; bottom-right panel: 10.75 ≤ log M∗/M⊙ < 11, 0.371 ≤ z < 0.436, 11-Gyr-old SSP with Z = 0.2 and E(B − V) = 0.4. The stacked spectra before stellar continuum subtraction and the stellar templates have been shifted up by arbitrary quantities for clarity.
Current usage metrics show cumulative count of Article Views (full-text article views including HTML views, PDF and ePub downloads, according to the available data) and Abstracts Views on Vision4Press platform.
Data correspond to usage on the plateform after 2015. The current usage metrics is available 48-96 hours after online publication and is updated daily on week days.
Initial download of the metrics may take a while.