Free Access
Fig. 6
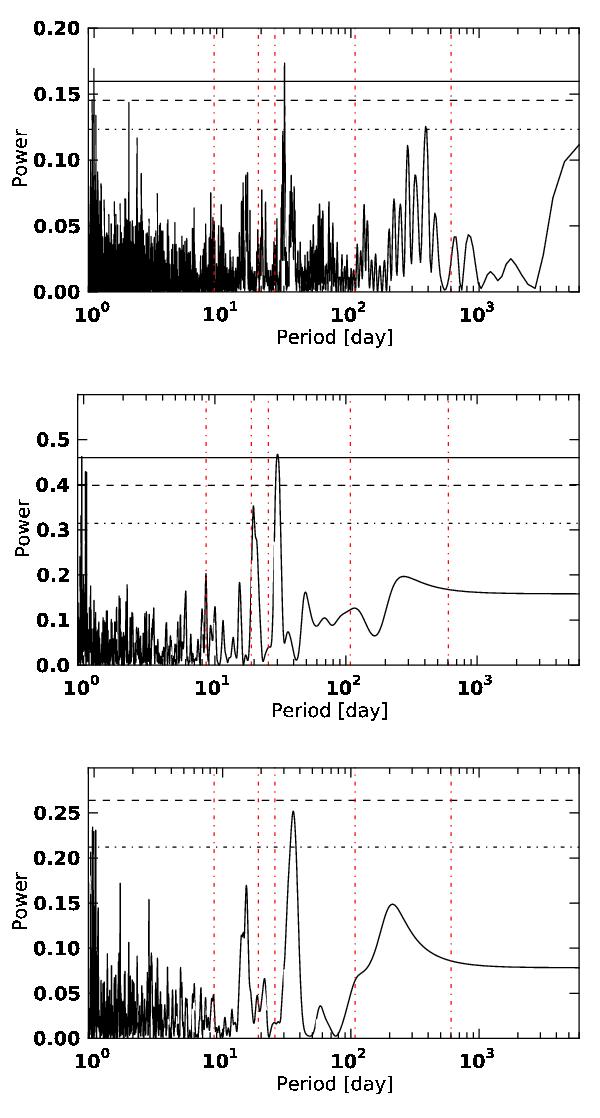
Periodogram of the full width at half maximum of the cross-correlation function for both the whole data set (top panel), season 2008 only (middle panel), and season 2009 (bottom panel). For reference, the period of RV signals are shown with vertical red dashed lines.
Current usage metrics show cumulative count of Article Views (full-text article views including HTML views, PDF and ePub downloads, according to the available data) and Abstracts Views on Vision4Press platform.
Data correspond to usage on the plateform after 2015. The current usage metrics is available 48-96 hours after online publication and is updated daily on week days.
Initial download of the metrics may take a while.