Fig. 5
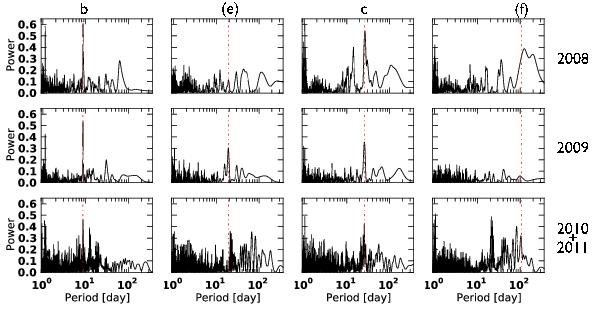
Seasonal periodograms of residual time series obtained after fitting the RV time series with four-planet models. From top to bottom, the rows are for seasons 2008, 2009, and 2010+2011, respectively. From left to right, the columns are periodograms to investigate signals b, (e), c, and (f), respectively. The periodicity of each signal is located with a vertical dashed red line. Power excesses are seen at all seasons for signals b and c, but not for signals (e) and (f).
Current usage metrics show cumulative count of Article Views (full-text article views including HTML views, PDF and ePub downloads, according to the available data) and Abstracts Views on Vision4Press platform.
Data correspond to usage on the plateform after 2015. The current usage metrics is available 48-96 hours after online publication and is updated daily on week days.
Initial download of the metrics may take a while.