Fig. 1
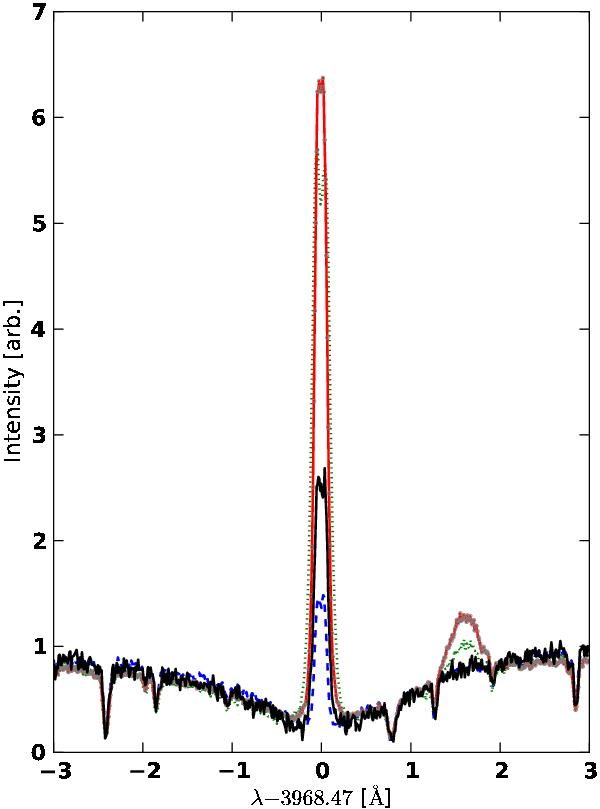
Emission reversal in the Ca ii H line of GJ 674 (red line; M2.5V; Prot = 35 d), GJ 176 (green dots; M2V; Prot = 39 d), GJ 163 (black line; M3.5), and GJ 581 (blue dashes; M3V; Prot = 94 d), ordered from the most prominent to the least prominent peaks. GJ 163 displays a lower activity level, which is a strong indication of slow rotation.
Current usage metrics show cumulative count of Article Views (full-text article views including HTML views, PDF and ePub downloads, according to the available data) and Abstracts Views on Vision4Press platform.
Data correspond to usage on the plateform after 2015. The current usage metrics is available 48-96 hours after online publication and is updated daily on week days.
Initial download of the metrics may take a while.