Fig. 1
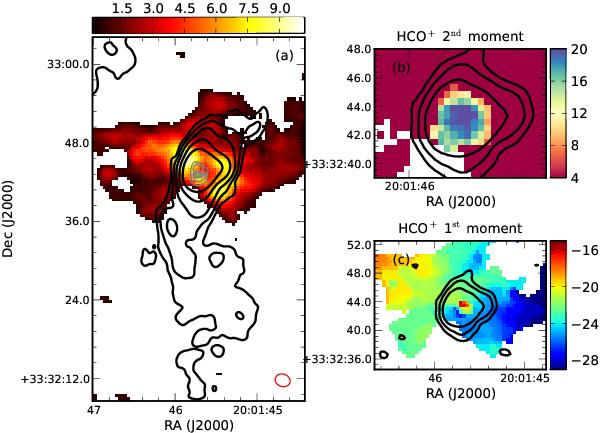
HCO+ in K3-50A. a) HCO+ (J = 1 − 0) integrated intensity with VLA 14.7 and 23 GHz continuum contours in black and gray. The contours are 3, 10, 30, 100 and 300 times the rms noise levels given in Table 1. The color scale has units of Jy beam-1 km s-1, and the beam is shown in the bottom right corner. b) HCO+ velocity dispersion map. The color scale has units of km s-1 and shows a sharp change in velocity dispersion at the edges of the HII region. The black contours here show the 90 GHz continuum, and are 3, 10 and 30 times the 90 GHz continuum rms noise (6.8 mJy beam-1). c) The HCO+ intensity weighted velocity map. The color scale units are km s-1, and the contours are the same as in panel b).
Current usage metrics show cumulative count of Article Views (full-text article views including HTML views, PDF and ePub downloads, according to the available data) and Abstracts Views on Vision4Press platform.
Data correspond to usage on the plateform after 2015. The current usage metrics is available 48-96 hours after online publication and is updated daily on week days.
Initial download of the metrics may take a while.