Fig. 5
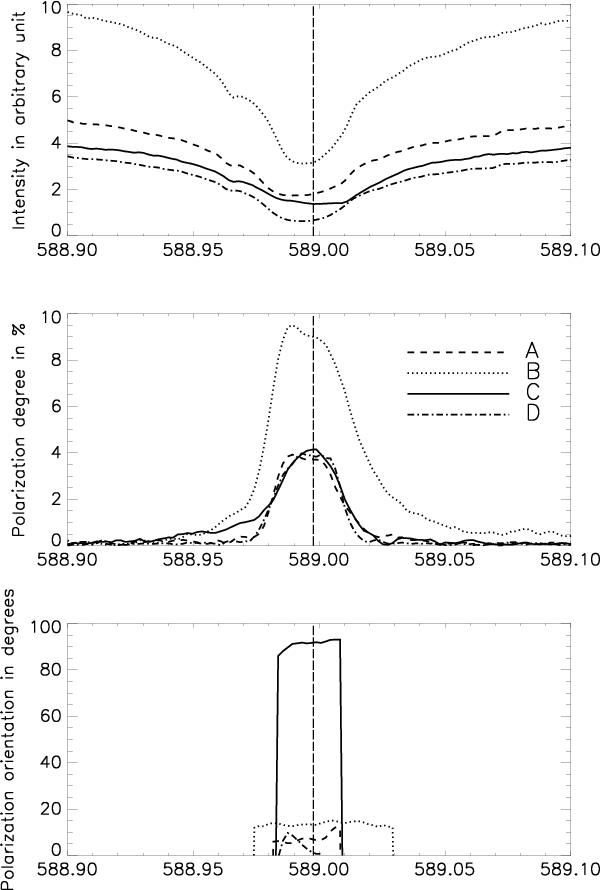
Line intensity and line polarization degree spectral profiles (top) and line polarization orientation spectral profile (bottom), at locations A, B, C, and D (see Fig. 4). Dashed vertical lines give wavelength position of the Na D2 line, when solar rotation is taken into account.
Current usage metrics show cumulative count of Article Views (full-text article views including HTML views, PDF and ePub downloads, according to the available data) and Abstracts Views on Vision4Press platform.
Data correspond to usage on the plateform after 2015. The current usage metrics is available 48-96 hours after online publication and is updated daily on week days.
Initial download of the metrics may take a while.