Fig. 4
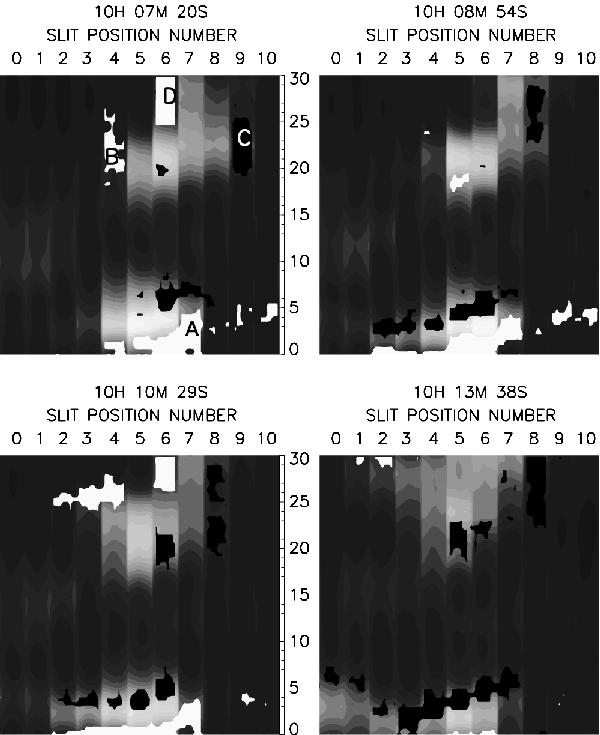
Polarization pseudo-spectroheliograms of 2001 June 15th two-ribbon flare derived from four observing time sets. Intensity levels are in grey. y axis is labeled in arcsec. Each x axis label identifies a narrow 2D spectra in a set of eleven adjacent and successive 2D spectra of wavelength width 0.032 nm, covering 11 pixels. They correspond to scans made along the x direction (with a δx 2.5 arcsec scan step). Regions with Na D2 linear polarization degree higher than 3%, and with either tangential or radial polarization directions are in black or white. On the 10H 07M 20S pseudo-spectroheliogram, four letters, A, B, C, D, indicate locations where line intensity, polarization degree and orientation profiles were computed (see Fig. 5).
Current usage metrics show cumulative count of Article Views (full-text article views including HTML views, PDF and ePub downloads, according to the available data) and Abstracts Views on Vision4Press platform.
Data correspond to usage on the plateform after 2015. The current usage metrics is available 48-96 hours after online publication and is updated daily on week days.
Initial download of the metrics may take a while.