Fig. 6
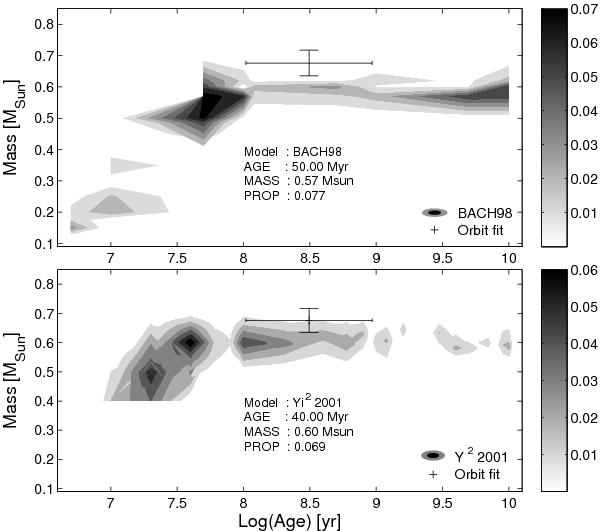
Surface plot of the results of a Monte-Carlo simulation of a comparison of the photometric measurements (MKs from NaCo and J − H from 2MASS) and evolutionary models by Baraffe et al. (1998) and Yi et al. (2001). Large probabilities are shown in dark colors and low probabilities are shown in light colors. The color bar on the right show the encoded probability. For the highest probability, the age and the mass are given in the corresponding subfigures. The datapoint shows the dynamical mass of HH Leo B+C, divided by 2, and the gyrochronological age of HH Leo for comparison.
Current usage metrics show cumulative count of Article Views (full-text article views including HTML views, PDF and ePub downloads, according to the available data) and Abstracts Views on Vision4Press platform.
Data correspond to usage on the plateform after 2015. The current usage metrics is available 48-96 hours after online publication and is updated daily on week days.
Initial download of the metrics may take a while.