| Issue |
A&A
Volume 556, August 2013
|
|
|---|---|---|
| Article Number | C3 | |
| Number of page(s) | 1 | |
| Section | The Sun | |
| DOI | https://doi.org/10.1051/0004-6361/201014301e | |
| Published online | 05 August 2013 | |
Sunspot group tilt angles and the strength of the solar cycle (Corrigendum)
1
Max-Planck-Institut für Sonnensystemforschung, Max-Planck-Str. 2, 37191
Katlenburg-Lindau,
Germany
e-mail: This email address is being protected from spambots. You need JavaScript enabled to view it.
2
School of Space Research, Kyung Hee University,
Yongin, 446-701
Gyeonggi,
Korea
3
Astronomical Institute, St. Petersburg State University,
Russia
Key words: sunspots / Sun: dynamo / magnetic fields / Sun: activity / errata, addenda
In the published version of Dasi-Espuig et al. (2010), Fig. 4a shows the relationship between the cycle averaged tilt angle normalised by the mean latitude, ⟨ α ⟩/⟨ λ ⟩ , based on the Mount Wilson (MW) data, and the strength, S, of the same cycle. This figure is incorrect since the values of the cycle average tilt angles used, ⟨ α ⟩ , were based on the Kodaikanal (KK) data, while the cycle average latitudes, ⟨ λ ⟩ , were based on the MW data. This error also affected the correlation coefficients between the cycle area-weighted tilt angles normalised by the mean latitude, ⟨ αω ⟩/⟨ λ ⟩ , and the S of the same cycle.
Here we present the correct plot in Fig. 1 using the MW data for both the cycle average tilt angles and latitudes. Figure 1 is now in agreement with the results of Ivanov (2012), and of McClintock & Norton (2013) who also employed the MW data in a similar analysis. The corresponding correlation coefficients are listed in Table 1 together with the probability that these are due to chance. Also listed are the correlation coefficients of the relationships using ⟨ αω ⟩/⟨ λ ⟩ .
We want to stress that this error only affected the relationships of the normalised cycle average and cycle area-weighted average tilt angles based on the MW data, with the S of the same cycle. Therefore, all of the results based on the KK data, and the results based on the MW data of the relationships with the S of the next cycle remain unchanged. Since the correlation coefficient of the corrected anticorrelation between ⟨ α ⟩/⟨ λ ⟩ and the S of the same cycle is weaker than in the published version, point (3) in Sect. 5 should say “A negative correlation between the normalised tilt angle, or ⟨ α ⟩/⟨ λ ⟩ , and the strength of the same cycle is found (rc = −0.79 and rc = −0.93 for MW and KK, respectively)”. The rest of the conclusions remain unchanged.
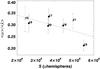 |
Fig. 1 Corrected Fig. 4a of Dasi-Espuig et al. (2010). Cycle averaged tilt angle normalised by the mean latitude vs. the strength of the same cycle based on MW data (rc = −0.79). The error bars represent 1σ error and the dashed line a linear fit to the points. Cycles 15 and 21 are shown as squares with dashed lines for the error bars because of their incompleteness. |
Corrected correlation coefficients shown in Table 2 of Dasi-Espuig et al. (2010), rc, between the four quantities described in the published version based on the tilt angle and the strength (S), amplitude (A), and length (L) of the same cycle, and the probability that the correlation is due to chance, P, for the MW (cycles 16–20) data set.
References
- Dasi-Espuig, M., Solanki, S. K., Krivova, N. A., Cameron, R., & Peñuela, T. 2010, A&A, 518, A7 [NASA ADS] [CrossRef] [EDP Sciences] [Google Scholar]
- Ivanov, V. G. 2012, Geomagnetism and Aeronomy, 52, 999 [Google Scholar]
- McClintock, B. H., & Norton, A. A. 2013, Sol. Phys., in press [arXiv:1305.3205] [Google Scholar]
© ESO, 2013
All Tables
Corrected correlation coefficients shown in Table 2 of Dasi-Espuig et al. (2010), rc, between the four quantities described in the published version based on the tilt angle and the strength (S), amplitude (A), and length (L) of the same cycle, and the probability that the correlation is due to chance, P, for the MW (cycles 16–20) data set.
All Figures
|
Fig. 1 Corrected Fig. 4a of Dasi-Espuig et al. (2010). Cycle averaged tilt angle normalised by the mean latitude vs. the strength of the same cycle based on MW data (rc = −0.79). The error bars represent 1σ error and the dashed line a linear fit to the points. Cycles 15 and 21 are shown as squares with dashed lines for the error bars because of their incompleteness. |
| In the text | |
Current usage metrics show cumulative count of Article Views (full-text article views including HTML views, PDF and ePub downloads, according to the available data) and Abstracts Views on Vision4Press platform.
Data correspond to usage on the plateform after 2015. The current usage metrics is available 48-96 hours after online publication and is updated daily on week days.
Initial download of the metrics may take a while.