Fig. 1
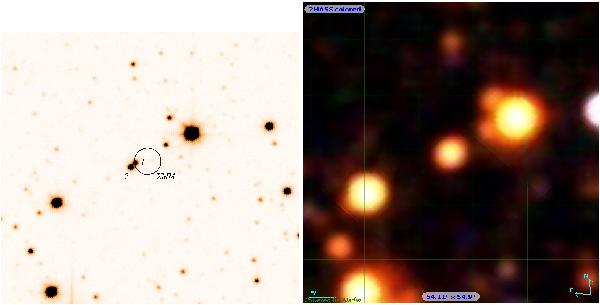
Left panel: 15′′ × 15′′K finding chart for 2XMM J191043.47+091629.4. The black circle is centred on the XMM-Newton position of 2XMM J191043.47+091629.4, with the radius indicating the 2.13′′ positional error. Right panel: 3.6′ × 2.6′ 2MASS coloured map. The images are displayed with north up and east to the left. We note that the two near-IR UKIDSS sources appear unresolved in the 2MASS image.
Current usage metrics show cumulative count of Article Views (full-text article views including HTML views, PDF and ePub downloads, according to the available data) and Abstracts Views on Vision4Press platform.
Data correspond to usage on the plateform after 2015. The current usage metrics is available 48-96 hours after online publication and is updated daily on week days.
Initial download of the metrics may take a while.