Fig. 6
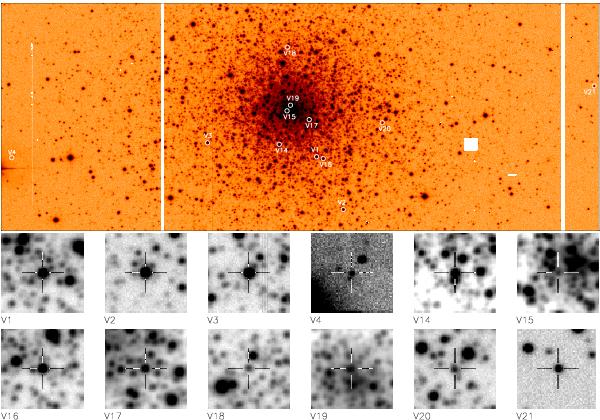
Finding chart for the confirmed variable objects in M 30, using our V reference image. North is up and east is to the right. The image size is 11.57 × 4.55 arcmin2, while each stamp size is 23.4 × 23.4 arcsec2. White circles and labels indicate the locations of the variables, and each of the variables we detect in our data is shown with a crosshair at the centre of an individual stamp. Note that the display scale of each stamp is different in order to make the source visible.
Current usage metrics show cumulative count of Article Views (full-text article views including HTML views, PDF and ePub downloads, according to the available data) and Abstracts Views on Vision4Press platform.
Data correspond to usage on the plateform after 2015. The current usage metrics is available 48-96 hours after online publication and is updated daily on week days.
Initial download of the metrics may take a while.