Fig. 10
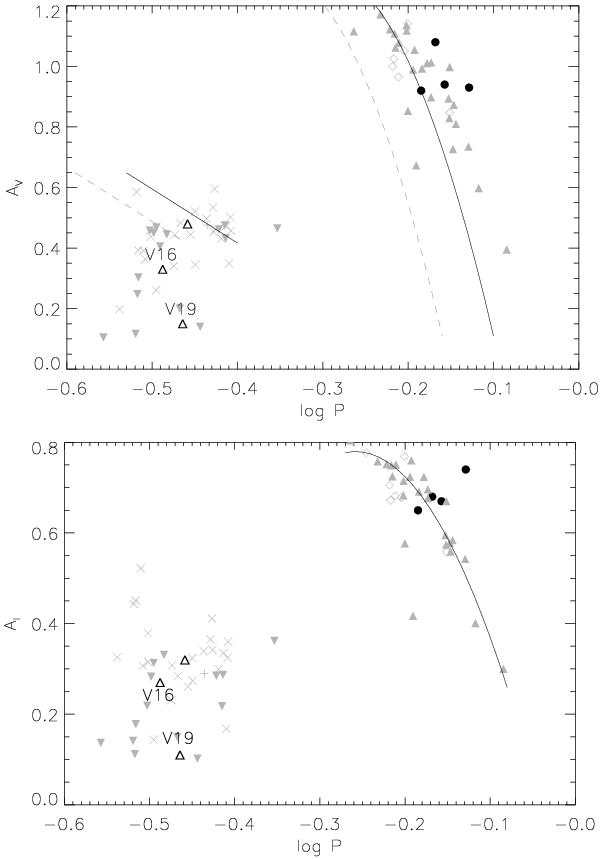
Bailey diagram of the light curve amplitude versus the logarithm of the period for RR Lyrae stars in M 30, in V (top) and I (bottom). RR0 variables are plotted as filled circles, and RR1 variables as open triangles; we mark the locations of V16 which we suggest is affected by Blazhko effects or non-radial pulsation, and of V19, which has an underestimated amplitude due to blending. Also plotted on the V-band diagram as solid lines are the relations of Cacciari et al. (2005) for evolved stars, obtained by applying a shift of +0.06 to log P in the relations derived for the Oosterhoff type I cluster M 3; the original relations (without the shift of 0.06 in log P) are also plotted in light grey dashed lines. For the I-band we plot the relation derived by Arellano Ferro et al. (2011) for RR0 stars. For comparison we also plot the populations of RR Lyrae detected in the Oosterhoff type II clusters M 9 (Arellano Ferro et al., in prep.) and NGC 5024 (Arellano Ferro et al. 2011) in light grey, with filled triangles and inverted triangles for RR0 and RR1 stars respectively. For stars with Blazhko effects, we use open diamonds for RR0 stars and crosses for RR1 stars; the star marked with a + sign is a double-mode RR1 star.
Current usage metrics show cumulative count of Article Views (full-text article views including HTML views, PDF and ePub downloads, according to the available data) and Abstracts Views on Vision4Press platform.
Data correspond to usage on the plateform after 2015. The current usage metrics is available 48-96 hours after online publication and is updated daily on week days.
Initial download of the metrics may take a while.