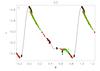
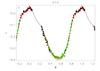
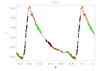
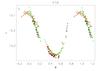
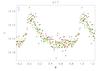
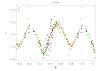
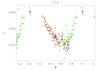
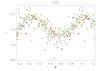
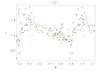
Fig. 4
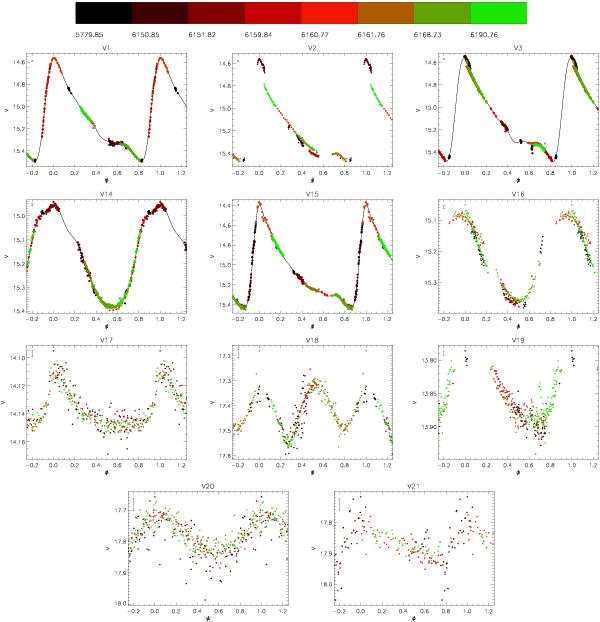
Phased V-band light curves of the variables with a period estimate. Different colours are used for different nights, with the colour coding given in the form of a colour bar spanning the whole time range of the observations (top panel). Fourier decomposition fits are overplotted for the objects for which those were successful.
Current usage metrics show cumulative count of Article Views (full-text article views including HTML views, PDF and ePub downloads, according to the available data) and Abstracts Views on Vision4Press platform.
Data correspond to usage on the plateform after 2015. The current usage metrics is available 48-96 hours after online publication and is updated daily on week days.
Initial download of the metrics may take a while.