Fig. 9
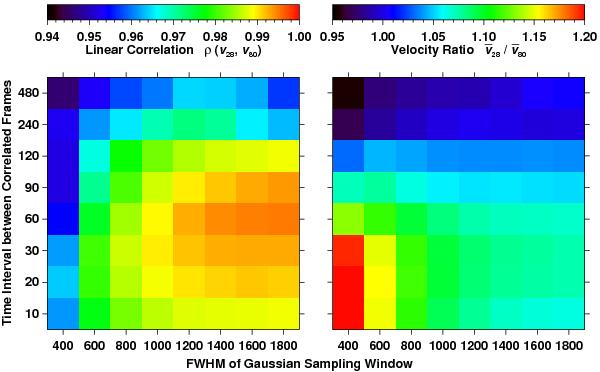
Correlation ρ(v28,v80) (left) and mean velocity ratio v28/v80 (right) between the flow maps computed from full-resolution images (v28) and from images convolved with a Gaussian of FWHM = 160 km (v80) to match the spatial resolution of Hinode G-band images. For both cases, flow maps were computed with time cadence Δt = 10–480 s and Gaussian sampling windows with an FWHM = 400–1800 km, shown here as 8 × 8 square blocks.
Current usage metrics show cumulative count of Article Views (full-text article views including HTML views, PDF and ePub downloads, according to the available data) and Abstracts Views on Vision4Press platform.
Data correspond to usage on the plateform after 2015. The current usage metrics is available 48-96 hours after online publication and is updated daily on week days.
Initial download of the metrics may take a while.