Fig. 8
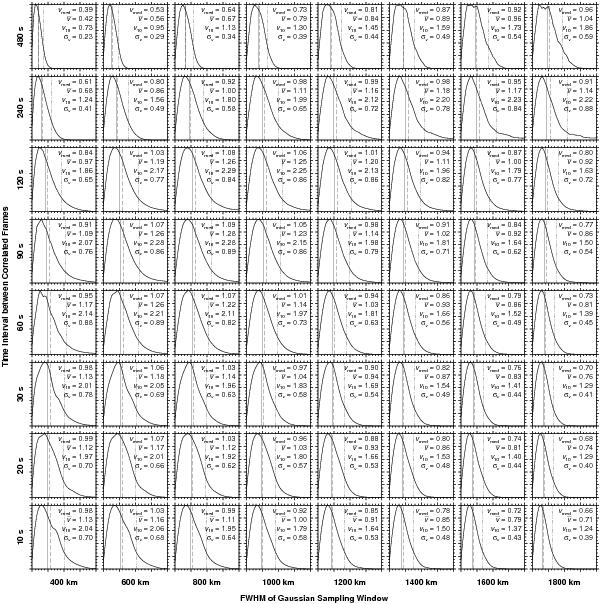
Relative frequency distributions of horizontal flow speeds computed with time cadences Δt = 10–480 s (bottom to top) and Gaussian sampling windows with an FWHM = 400–1800 km (left to right). The three vertical lines mark the position of median vmed (solid), mean  (long-dashed), and 10th percentile v10 (dash-dotted) values of speed. The frequency distributions were normalized such that the modal values correspond to unity, i.e., major tickmarks are separated by 0.2 on the ordinate. The speed distributions cover the range 0.0–4.0 km s-1, i.e., major tickmarks are separated by 1.0 km s-1 on the abscissae.
Current usage metrics show cumulative count of Article Views (full-text article views including HTML views, PDF and ePub downloads, according to the available data) and Abstracts Views on Vision4Press platform.
Data correspond to usage on the plateform after 2015. The current usage metrics is available 48-96 hours after online publication and is updated daily on week days.
Initial download of the metrics may take a while.