Fig. 7
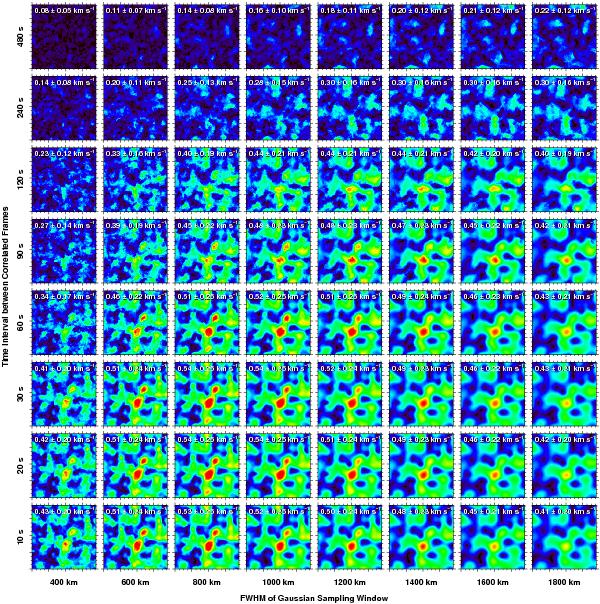
Horizontal flow speed maps (one-hour averages) computed with time cadences Δt = 10–480 s (bottom to top) and Gaussian kernels with an FWHM = 400–1800 km (left to right). Displayed at the top of the panels are the mean speed  and its standard deviation σv averaged over the FOV. The speed maps are scaled between 0.0–1.2 km s-1, which corresponds to the scale used in Figs. 2 and 3. Axes are in megameters with the major tickmarks separated by 2 Mm.
Current usage metrics show cumulative count of Article Views (full-text article views including HTML views, PDF and ePub downloads, according to the available data) and Abstracts Views on Vision4Press platform.
Data correspond to usage on the plateform after 2015. The current usage metrics is available 48-96 hours after online publication and is updated daily on week days.
Initial download of the metrics may take a while.