Fig. 5
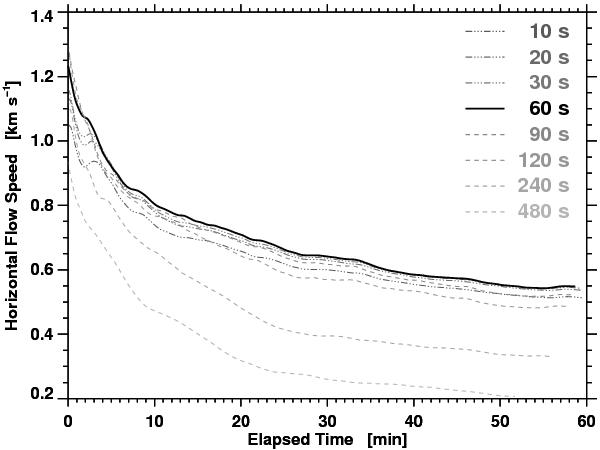
Average horizontal flow speed as a function of the elapsed time. The maps were computed using a Gaussian sampling window with an FWHM = 1200 km and time cadence Δt = 10–480 s. The increasing time cadences Δt are presented as progressively lighter shades of gray. The black solid line is depicting the result for the time cadence Δt = 60 s, which has been identified in Verma & Denker (2011) as an optimal choice for tracking horizontal proper motions in Hinode G-band time-series data.
Current usage metrics show cumulative count of Article Views (full-text article views including HTML views, PDF and ePub downloads, according to the available data) and Abstracts Views on Vision4Press platform.
Data correspond to usage on the plateform after 2015. The current usage metrics is available 48-96 hours after online publication and is updated daily on week days.
Initial download of the metrics may take a while.