Fig. 4
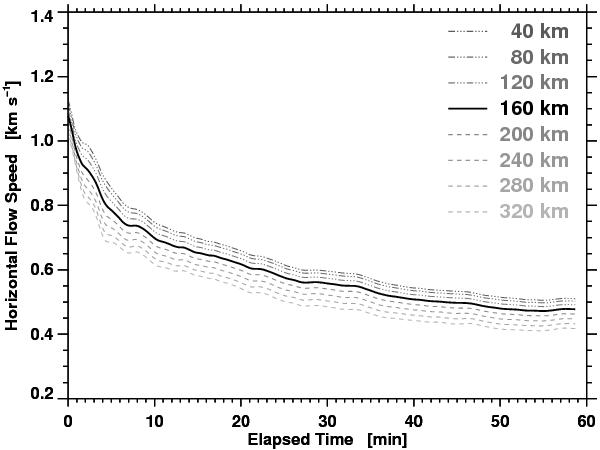
Average horizontal flow speed as a function of the elapsed time. The maps were computed using a Gaussian sampling window with an FWHM = 1200 km and time cadence Δt = 60 s. Before computing the cross-correlations, the images were convolved with a Gaussian kernel FWHM = 40–320 km to degrade the spatial resolution of the images. The increasing FWHM values are presented as progressively lighter shades of gray. The dash-dotted and dashed lines represents values above and below optimal parameter (FWHM = 160 km), respectively. The black solid line is used to depict result for the FWHM = 160 km, which is the typical spatial resolution of most Hinode G-band images (see Verma & Denker 2011).
Current usage metrics show cumulative count of Article Views (full-text article views including HTML views, PDF and ePub downloads, according to the available data) and Abstracts Views on Vision4Press platform.
Data correspond to usage on the plateform after 2015. The current usage metrics is available 48-96 hours after online publication and is updated daily on week days.
Initial download of the metrics may take a while.