Fig. 2
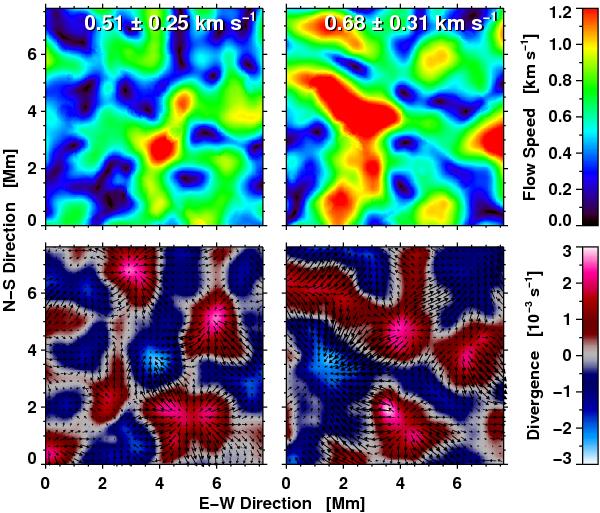
Average speed (top) and divergence (bottom) maps for the first (left) and last (right) hour of the time series computed using a time cadence of Δt = 60 s and a Gaussian sampling window with an FWHM = 1200 km. The direction and magnitude of the horizontal flows are plotted over the divergence maps as arrows, for which a velocity of 0.5 km s-1 corresponds to exactly the grid spacing. The values displayed at the top are the mean speed  and its standard deviation σv for the one-hour averaged flow maps.
Current usage metrics show cumulative count of Article Views (full-text article views including HTML views, PDF and ePub downloads, according to the available data) and Abstracts Views on Vision4Press platform.
Data correspond to usage on the plateform after 2015. The current usage metrics is available 48-96 hours after online publication and is updated daily on week days.
Initial download of the metrics may take a while.