Fig. 16
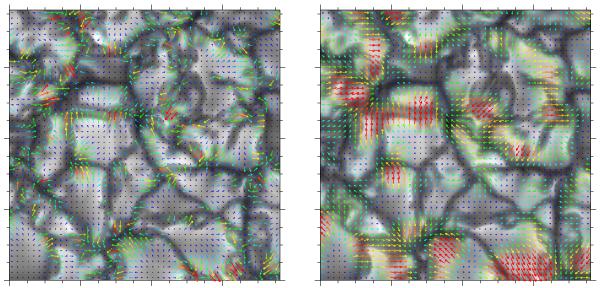
First gray-scale intensity image of the time series overplotted with the actual (left) and smoothed CO5BOLD plasma velocity vectors at log τ = +1 (see left most panel in Fig. 10 for the corresponding LCT flow vectors). The flow field was smoothed using a Gaussian kernel with an FWHM = 686 km (see Fig. 15) corresponding to the maximum correlation coefficient between plasma and LCT (time cadence Δt = 60 s and Gaussian sampling window with an FWHM = 1200 km) velocities. The speed and direction of the flow field are given by rainbow-colored arrows, where dark blue corresponds to low and red to high velocities within the range of 0.75–7.5 km s-1 and 0.3–3.0 km s-1 for the actual and smoothed flow fields, respectively. The time-dependent CO5BOLD flow fields are shown in Movie 2, which is provided in the electronic edition.
Current usage metrics show cumulative count of Article Views (full-text article views including HTML views, PDF and ePub downloads, according to the available data) and Abstracts Views on Vision4Press platform.
Data correspond to usage on the plateform after 2015. The current usage metrics is available 48-96 hours after online publication and is updated daily on week days.
Initial download of the metrics may take a while.