Fig. 15
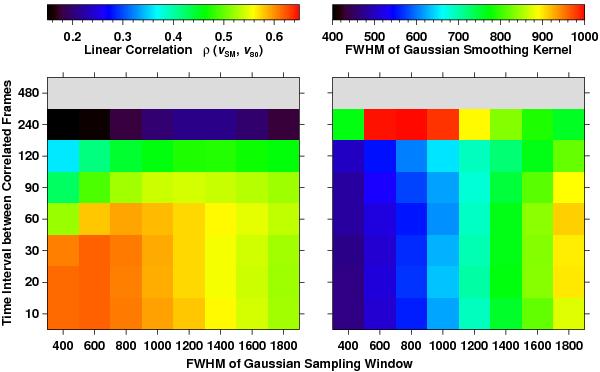
Maximum correlation ρ(vsm,v80) (left) and corresponding FWHM of Gaussian kernel (right) used to smooth the actual flow map vsm. For both cases, the maps were averaged over one hour. The LCT flow maps were computed for images with an image-scale of 80 km pixel-1 matching Hinode G-band images, using time cadences of Δt = 10−480 s and Gaussian sampling windows with an FWHM = 400−1800 km, shown here as 8 × 8 square blocks. Gray blocks indicate parameters, where the linear correlation did not deliver meaningful results.
Current usage metrics show cumulative count of Article Views (full-text article views including HTML views, PDF and ePub downloads, according to the available data) and Abstracts Views on Vision4Press platform.
Data correspond to usage on the plateform after 2015. The current usage metrics is available 48-96 hours after online publication and is updated daily on week days.
Initial download of the metrics may take a while.