Fig. 13
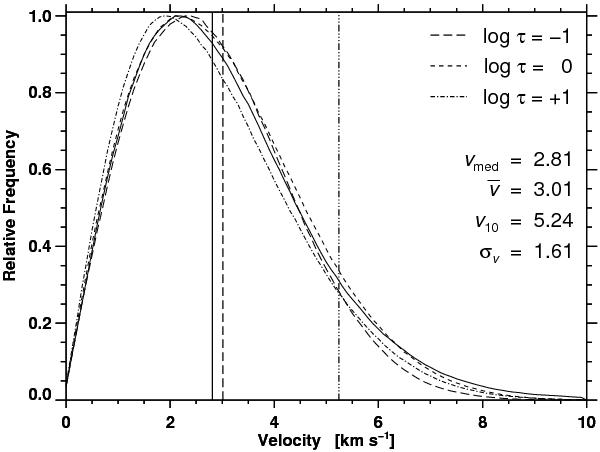
Relative frequency distributions for the horizontal plasma velocities corresponding to different optical depths of log τ = −1, 0, and +1, which are depicted as long-dashed, dashed, and dash-dotted curves, respectively. The three vertical lines mark the position of median vmed (solid), mean  (long-dashed), and 10th percentile v10 (dash-dotted) values of speed at an optical depth of log τ = 0. A frequency distribution (solid) for LCT flow velocities was stretched by a factor of about three so that the root-mean-square deviation from the profile with log τ = 0 was minimal. The LCT input parameters were image scale 80 km pixel-1, time cadence Δt = 60 s, and a Gaussian sampling window with an FWHM = 1200 km.
Current usage metrics show cumulative count of Article Views (full-text article views including HTML views, PDF and ePub downloads, according to the available data) and Abstracts Views on Vision4Press platform.
Data correspond to usage on the plateform after 2015. The current usage metrics is available 48-96 hours after online publication and is updated daily on week days.
Initial download of the metrics may take a while.