Fig. 12
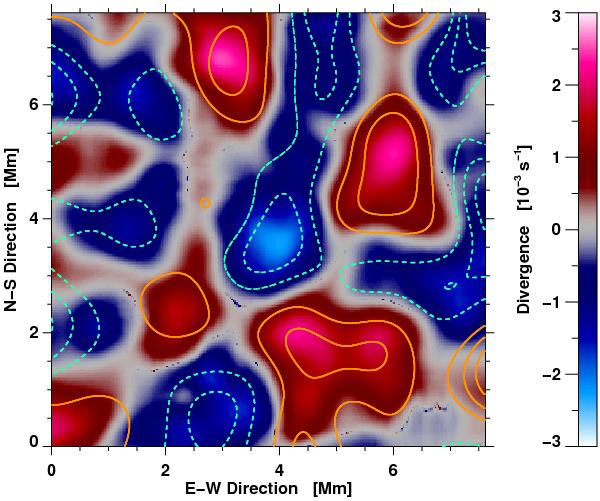
LCT divergence map computed for input parameters: image scale 80 km pixel-1, time cadence Δt = 60 s, Gaussian sampling window with an FWHM = 1200 km, and averaging time ΔT = 1 h. Overplotted are the contours of the corresponding one-hour averaged divergence of the actual flow velocity smoothed by a Gaussian with an FWHM = 1266 km. Orange (solid) and blue (dashed) lines indicate positive and negative (± 1, ± 2 and ± 3 × 10⁻³ s-1) divergence, respectively.
Current usage metrics show cumulative count of Article Views (full-text article views including HTML views, PDF and ePub downloads, according to the available data) and Abstracts Views on Vision4Press platform.
Data correspond to usage on the plateform after 2015. The current usage metrics is available 48-96 hours after online publication and is updated daily on week days.
Initial download of the metrics may take a while.