Free Access
Fig. 11
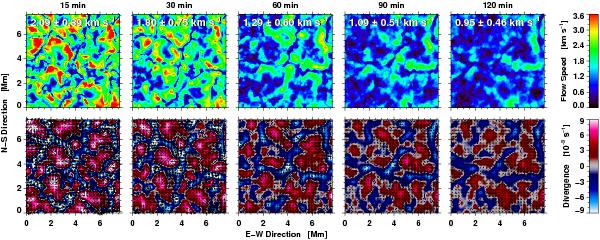
Speed (top) and divergence (bottom) maps averaged over time intervals of ΔT = 15–120 min of the horizontal plasma velocities corresponding to an optical depth of log τ = 0. The speed and divergence values are larger roughly by a factor of three as compared to Fig. 3.
Current usage metrics show cumulative count of Article Views (full-text article views including HTML views, PDF and ePub downloads, according to the available data) and Abstracts Views on Vision4Press platform.
Data correspond to usage on the plateform after 2015. The current usage metrics is available 48-96 hours after online publication and is updated daily on week days.
Initial download of the metrics may take a while.