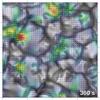
Fig. 10
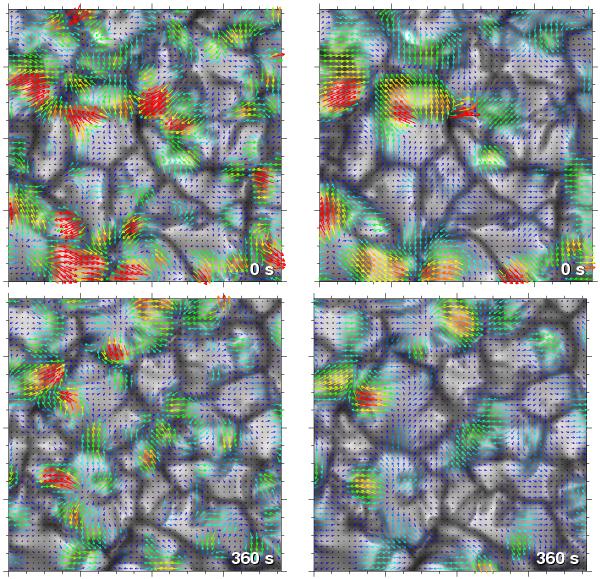
Temporal evolution of flow fields for different time intervals between successive images and sampling window sizes: Δt = 20 s and FWHM = 600 km (left) and Δt = 60 s and FWHM = 1200 km (right). The time stamp in the lower right corner indicates the time elapsed since the beginning of the time series. The original flow maps were derived from just one pair of correlated images per time step. These maps with 273 × 273 pixels were then resampled to 50 × 50 pixels before applying a sliding average over the leading and trailing four flow maps. Speed and direction of the horizontal proper motions are given by rainbow-colored arrows (dark blue corresponds to speeds lower than 0.2 km s-1 and red to larger than 2.0 km s-1), which were superposed on the corresponding gray-scale intensity images of the CO5BOLD simulation. Major tickmarks are separated by 2 Mm. The time-dependent LCT flow fields are shown in Movie 1, which is provided in the electronic edition.
Current usage metrics show cumulative count of Article Views (full-text article views including HTML views, PDF and ePub downloads, according to the available data) and Abstracts Views on Vision4Press platform.
Data correspond to usage on the plateform after 2015. The current usage metrics is available 48-96 hours after online publication and is updated daily on week days.
Initial download of the metrics may take a while.