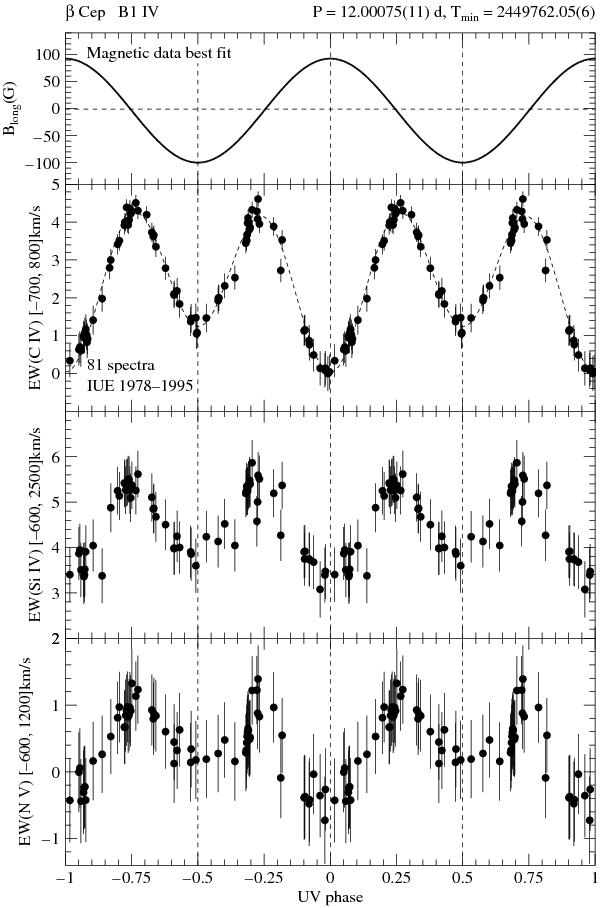
Fig. 6

Phase behaviour of the stellar wind lines and magnetic variation. Upper panel: best sinusoid fit to the magnetic data of β Cep as a function of the UV phase, using a fixed period of 12.00075 d, as derived from UV data. Two rotational periods are displayed. Vertical dashed lines at phases 0.5 and 1 serve as a reference for comparison with the stellar wind behaviour. Lower panels, respectively, from top to bottom: equivalent width of the C iv, Si iv, and N v stellar wind lines measured in IUE spectra taken during 16 years as a function of phase, which is calculated with Eq. (3). The deepest minimum, defined as phase 0, corresponds to the maximum emission, which occurs when the magnetic North pole is pointing most to the observer. Note that there is no significant difference in zero phase between the UV and magnetic data but that the field crosses zero slightly besides the EW maxima, as discussed in Sect. 4.3
Current usage metrics show cumulative count of Article Views (full-text article views including HTML views, PDF and ePub downloads, according to the available data) and Abstracts Views on Vision4Press platform.
Data correspond to usage on the plateform after 2015. The current usage metrics is available 48-96 hours after online publication and is updated daily on week days.
Initial download of the metrics may take a while.


