Fig. 4
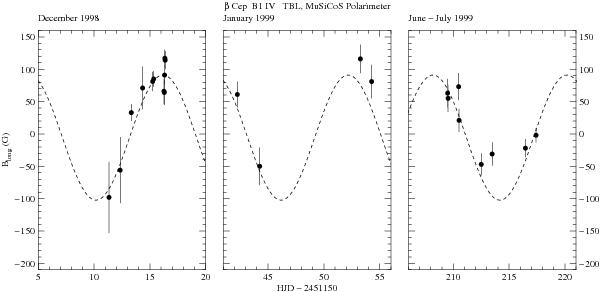
The discovery observations, which include the first 23 datapoints from December 1998 until July 1999. The longitudinal component of the averaged surface magnetic field of β Cep is plotted. The dashed curve is the best-fit sine curve for all magnetic data with a fixed period of 12.00075 d, as derived from UV data.
Current usage metrics show cumulative count of Article Views (full-text article views including HTML views, PDF and ePub downloads, according to the available data) and Abstracts Views on Vision4Press platform.
Data correspond to usage on the plateform after 2015. The current usage metrics is available 48-96 hours after online publication and is updated daily on week days.
Initial download of the metrics may take a while.