Fig. 2
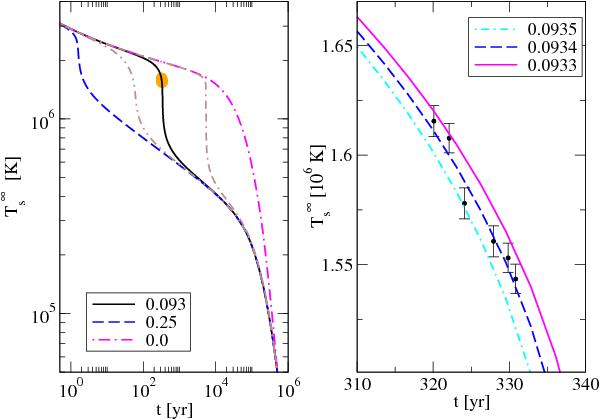
Left panel. Dependence of the redshifted surface
temperature (logarithmic scale) on time for the values of the transition temperature
T∗ (in MeV) indicated in the plot and for fixed width
w = 0.2 MeV. We also show the same dependence for
T∗ = 0.093 and w = 0.3
(dash-double-dotted line) and w = 0.1 (double-dash-dotted line). The
underlying model is the 1.93 M⊙ compact star model of
Knippel & Sedrakian (2009).
Right panel. Dependence of the redshifted surface temperature (in
units of 106 K) on time for the same model. The points with error bars show
the Cas A data, and the solid lines are fits to these data by variation of
T∗ for fixed width w = 0.2 MeV. The
redshifted temperature measured by a distant observer is obtained as
 ,
where φS is the surface value of the
function φ, which is defined via the temporal component of the
spherically symmetrical metric according to
g00 = e2φ.
,
where φS is the surface value of the
function φ, which is defined via the temporal component of the
spherically symmetrical metric according to
g00 = e2φ.
Current usage metrics show cumulative count of Article Views (full-text article views including HTML views, PDF and ePub downloads, according to the available data) and Abstracts Views on Vision4Press platform.
Data correspond to usage on the plateform after 2015. The current usage metrics is available 48-96 hours after online publication and is updated daily on week days.
Initial download of the metrics may take a while.