Fig. 8
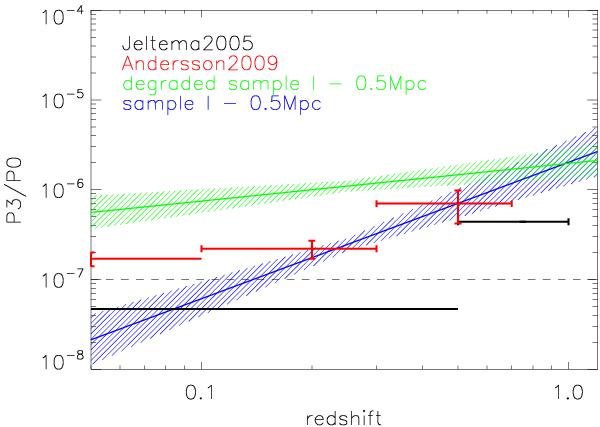
Comparison with previous studies. From Jeltema et al. (2005) we show the mean P3/P0 values for z < 0.5 and z > 0.5 objects (black). Errors on these values are not provided. In addition, we plot the mean P3/P0 of Andersson et al. (2009) for three redshift bins (0.069 < z < 0.1, 0.1 < z < 0.3 and z > 0.3) in red. We provide our slope of the P3/P0-z plane calculated using an aperture of 0.5 Mpc for sample I (blue line) and the degraded sample I (green line) including the 1-σ errors as dashed area. The dashed line indicates the P3/P0 boundary at 10-7.
Current usage metrics show cumulative count of Article Views (full-text article views including HTML views, PDF and ePub downloads, according to the available data) and Abstracts Views on Vision4Press platform.
Data correspond to usage on the plateform after 2015. The current usage metrics is available 48-96 hours after online publication and is updated daily on week days.
Initial download of the metrics may take a while.