Fig. 3
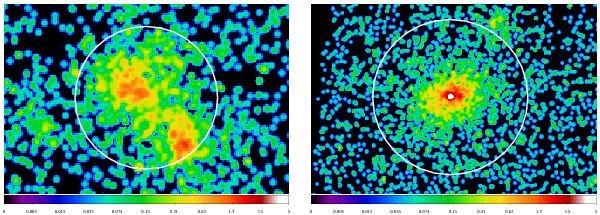
Examples of the background-included, point-source-corrected smoothed X-ray images of the high-z samples. Left: 0152-1358 – very structured cluster at z = 0.83 with P3/P0 = (5.76 ± 0.95) × 10-5 and w = (6.64 ± 0.57) × 10-2. This 400SD cluster has the highest P3/P0 value and is marked by a circle in Figs. 5−7. Right: SPT-CLJ0509-5342 – rather relaxed SPT cluster at z = 0.46 with a non-significant detection in P3/P0 and w = (3.13 ± 1.33) × 10-3. The circle indicates r500.
Current usage metrics show cumulative count of Article Views (full-text article views including HTML views, PDF and ePub downloads, according to the available data) and Abstracts Views on Vision4Press platform.
Data correspond to usage on the plateform after 2015. The current usage metrics is available 48-96 hours after online publication and is updated daily on week days.
Initial download of the metrics may take a while.